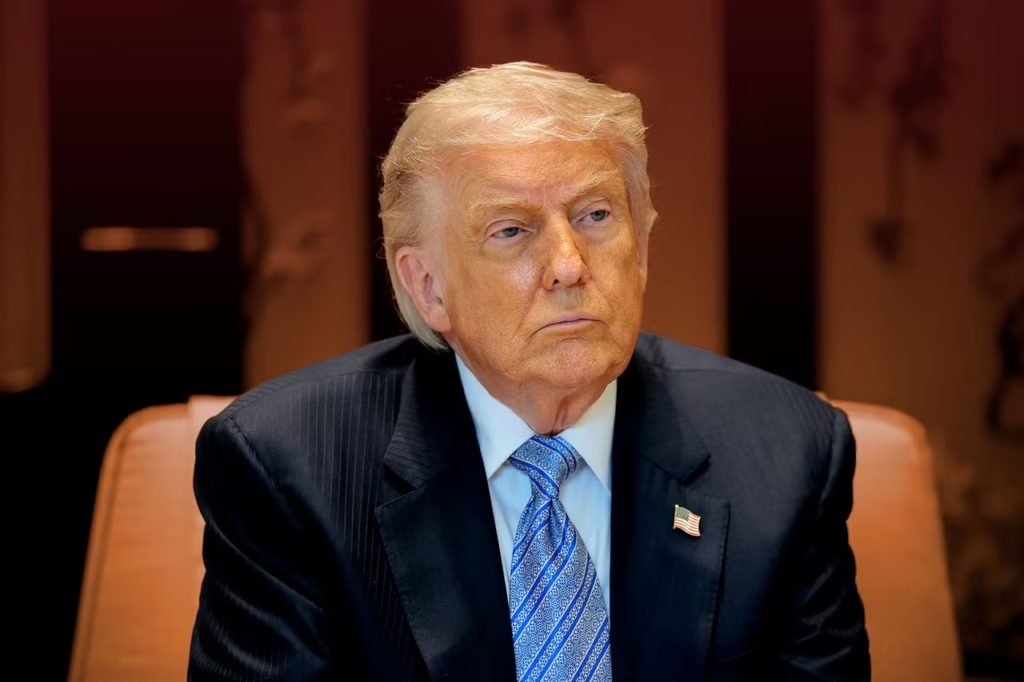
A new CNN poll places Trump’s overall approval at 34% — the exact level he hit in the aftermath of January 6, 2021, which was the worst single moment of his first term. But the numbers inside this poll are arguably more alarming for the White House than the headline figure: 73% say he’s not focused enough on the country’s most important problems. Two-thirds say his policies worsened economic conditions. And within his own party, enthusiastic support has nearly halved since spring — from 38% to just 19%.
2-MINUTE CONTEXT
Approval ratings in isolation tell you little. The question is always: what is driving the number, and is it recoverable? Trump’s 34% in the winter of 2021 was driven by a single dramatic event — the Capitol breach — that a significant portion of his supporters subsequently reclassified or rationalized. His 34% in August 2026 is driven by something structurally different: an active war, sustained elevated consumer prices, and mounting domestic policy controversies that compound daily rather than recede.
The January 6 low was recoverable because public attention moved on, the legal consequences unfolded slowly, and the economic backdrop remained relatively stable. The August 2026 low is embedded in an ongoing war that most Americans now believe will last “months or years longer,” gas prices that are directly, visibly affecting household budgets every week, and midterm elections that are 99 days away.
THE NUMBERS THAT MATTER MOST
| Overall approval 34% CNN poll — matches Jan 6, 2021 career low | Not focused on key problems 73% record high for this specific question |
| Policies worsened economy ~66% roughly two-thirds of respondents | Iran decisions “hurt US” ~66% two-thirds on military conduct |
| Republicans “enthusiastic” 19% down from 38% last spring | Made personally better off 13% down from 44% who expected this in 2024 |
THE REPUBLICAN ENTHUSIASM COLLAPSE
The headline figure (34%) reflects a combination of Democratic opposition, Independent disillusionment, and some Republican defection. Those are all documented and unsurprising. What is genuinely significant — and the number that should concern Republican campaign operatives most — is the Republican enthusiasm data.
Only 19% of Republicans describe themselves as “enthusiastic” about the rest of Trump’s second term. That is not a number about Democrats saying they hate Trump. That is a number about Trump’s own voters saying they are not fired up about what is coming. Base enthusiasm is one of the primary drivers of midterm turnout. You do not win midterms with a base that is 19% enthusiastic.
Contrast that with the 44% of Americans who, on the eve of the 2024 election, expected Trump’s policies to make them personally better off. Just 13% say that is actually happening. The gap between expectation and lived experience — 31 percentage points — is one of the most damaging numbers in this entire polling cycle.
“Just 13% of Americans now say Trump’s policies have made them personally better off — down from the 44% who expected exactly that on the eve of the 2024 election.”
— CNN analysis of CBS/YouGov polling, August 2, 2026
| 🔍 ONYX REALITY CHECK VERDICT: TRUE WHY? The 34% approval rating matching Trump’s January 6, 2021 low is documented by CNN’s own polling. The specific figures on Republican enthusiasm (19%, down from 38%), personal-betterment expectations (13% vs. 44% at election), and the “not focused enough” rating (73%) are all from the same CNN poll with published methodology. These are not disputed figures — they are published polling data from a named outlet with a disclosed methodology. |
WHY THIS MATTERS
Approval ratings do not vote. Voters vote. But approval ratings shape the environment in which voters make decisions. A president at 34% ninety-nine days before midterms creates a specific kind of electoral atmosphere — one in which vulnerable members of his own party distance themselves, fundraising becomes harder, and candidates in competitive districts must calculate whether associating with the president helps or hurts them.
The specific driver — the Iran war and its economic consequences — is not easily managed between now and November. Wars do not end on polling schedules. Gas prices do not drop because an election is coming. The structural conditions driving this number are likely to persist, which is why Republican strategists have already begun saying publicly that Trump “needs a win” before November.
POLITICAL IMPACT
▸ WHO LOSES MOST: House Republicans in competitive districts — a 34% presidential approval is a weight on every ticket
▸ WHO BENEFITS: Democrats — the approval number gives them a unified campaign theme heading into fall
▸ WHO FACES A CALCULATION: Republican senators from purple states — endorse Trump or create distance?
▸ WHO FEELS PRESSURE INTERNALLY: White House — Trump’s own party showing 19% enthusiasm is an internal alarm bell, not just a poll number
▸ WHO GAINS LEVERAGE: Potential Republican primary challengers — this is the kind of number that invites exploration
WHAT HAPPENS NEXT
▸ The White House will push the Gaza deal announcement hard — it’s the only “win” narrative available right now.
▸ Republican candidates in swing districts will show increasingly visible separation from Trump on economic messaging.
▸ Democratic campaign advertising for fall will be built around this specific polling dataset.
▸ Watch for internal Republican polling — if their own numbers match CNN’s, expect more public GOP criticism.
▸ A significant foreign policy or economic development before November could shift the number — but the bar is high.
| CONFIDENCE: HIGH | CNN polling with disclosed methodology. Numbers are internally consistent and corroborated by CBS/YouGov polling released the same week. Historical comparison to Jan 6, 2021 low is CNN’s own documented data. Republican enthusiasm figure is verifiable against prior CNN polling from last spring. |
| ⚖️ BIAS CHECK — WHO IS SAYING WHAT | |
| CNN / Mainstream Media | Framing as historic low; emphasizing January 6 comparison for narrative weight |
| Democrats | Using the poll as midterm campaign ammunition; particularly highlighting the personal-betterment expectation gap |
| Republicans (mainstream) | Disputing methodology; pointing to alternative polls showing higher numbers; arguing “voters choose at the ballot, not in polls” |
| Trump / White House | Calling the poll “fake news”; pointing to economic metrics they claim show strength |
| Republican Strategists (on record) | Acknowledging the concern privately, publicly more cautious — Alex Conant’s “needs a win” comment is the honest version |
| Independent Analysts | Noting the specific structural difference from the Jan 6 low — this one has economic root causes that persist |
SOURCES
▸ CNN poll — August 2026, specific figures cited from published polling data
▸ CBS News/YouGov poll — corroborating economic disapproval figures
▸ Historical CNN polling — January 2021 low comparison
▸ Alex Conant (GOP strategist) — “needs a win” quote contextualizing Republican concern
QUESTIONS YOU MAY STILL HAVE
Q: Can Trump recover from 34% before November?
A: Historically, presidential approval ratings can move significantly in 99 days — but recoveries of this magnitude typically require a major positive event (economic surge, major diplomatic win, national security success). None of those are currently on the horizon.
Q: Is 34% actually the lowest any president has ever been at this stage of a second term?
A: No — Nixon was lower during Watergate. But 34% is historically low for a president not facing an active impeachment or constitutional crisis. The comparison to Trump’s own January 6 low is the most useful benchmark.
Q: Does approval rating predict midterm outcomes?A: Strong correlation, not deterministic. Presidents below 45% approval typically lose seats in midterms. At 34%, the correlation is even stronger. But district-level factors, candidate quality, and turnout dynamics all matter significantly.