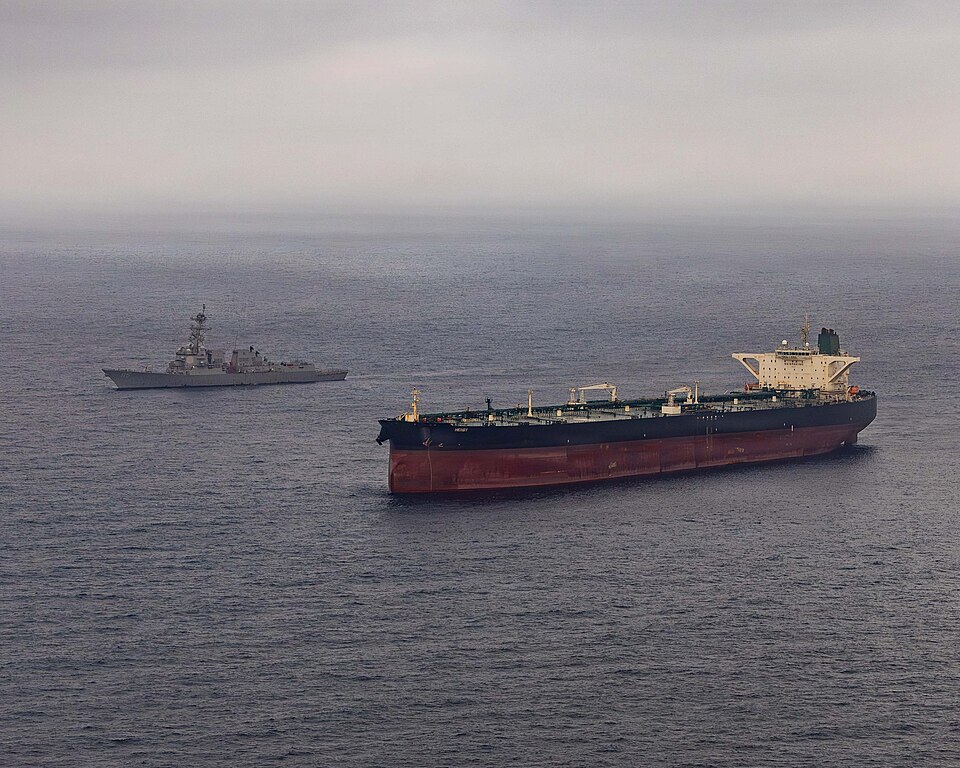
The US naval blockade of Iranian ports — in place from April 13 until modified under the August 7 ceasefire deal — intercepted 85 vessels and seized three ships outright, according to CENTCOM figures. Separately, Lloyd’s List confirms at least 26 vessels successfully bypassed the blockade. This gap between intended total effect and actual imperfect enforcement is the specific record of the blockade’s seven weeks of operation. As the ceasefire’s blockade modification takes effect and commercial shipping normalizes, understanding what the blockade actually accomplished and where it fell short is the accountability record for that specific policy instrument.
THE BLOCKADE IN NUMBERS
| Blockade start date Apr 13 Trump executive order, CENTCOM operational order | Blockade end/modification Aug 7 ceasefire deal — blockade modified, not lifted |
| Vessels intercepted 85 CENTCOM confirmed figures | Vessels seized outright 3 CENTCOM confirmed |
| Vessels that bypassed 26+ Lloyd’s List — documented bypass events | Estimated daily cost to Iran $500M economic analysis estimate during blockade period |
THE BYPASS GAP — WHY IT MATTERS
The 26 documented bypass events reveal the specific operational limitations of naval blockades in the Strait of Hormuz geography. The strait is approximately 39 kilometers wide at its narrowest point, with two 3-kilometer-wide shipping lanes plus a separation zone. Maintaining a blockade that intercepts every vessel requires either a physically impossible number of enforcement ships or a cooperation framework with Iran’s neighbors — Oman specifically, which controls part of the strait through its Musandam Peninsula.
The Oman-Iran bilateral mechanism that forms part of the ceasefire deal’s Hormuz governance framework is partly a product of this geography: full US enforcement without Omani cooperation was always going to be imperfect. The ceasefire’s Oman-Iran mechanism addresses the governance gap that produced the 26 bypasses.
THE $500 MILLION DAILY COST FIGURE
The $500 million daily cost estimate for the blockade’s economic impact on Iran reflects: oil export revenue foregone; disruption to import of essential goods; elevated insurance costs for any shipping that did occur; and the broader economic contraction associated with trade isolation. Whether this figure is accurate in the specific accounting depends on the baseline oil export volume and prices used. It is consistent with estimates from multiple economic analysis sources.
The key analytical question: did the $500 million daily economic pressure produce the ceasefire deal, or did other factors (US missile stockpile depletion, Joint Chiefs ‘off-ramp’ assessment, diplomatic pressure from China, India, Japan, and South Korea) drive the deal? Almost certainly both. The blockade was one element of a multi-instrument pressure campaign; attributing the deal specifically to any single instrument overstates our analytical confidence.
THE CEASEFIRE MODIFICATION — WHAT CHANGED
The August 7 ceasefire deal modified the blockade rather than lifting it. The modification restored humanitarian and some commercial shipping access to Iranian ports while maintaining the blockade’s restriction on weapons-related cargo, most Iranian oil exports (subject to existing sanctions), and military shipments. This is the ‘blockade modification’ term in ONYX’s prior coverage. The blockade has not ended; it has been adjusted to allow the commercial traffic that the ceasefire’s economic incentives require.
| CONFIDENCE: HIGH | CENTCOM figures (85 intercepted, 3 seized) are from confirmed CENTCOM reporting. Lloyd’s List bypass figure (26+) is from their confirmed reporting. $500M daily cost estimate is from economic analysis reports. Blockade start (April 13) and modification (August 7 ceasefire) are from established ONYX coverage. |
SOURCES
▸ CENTCOM — blockade interception figures (85 intercepted, 3 seized)
▸ Lloyd’s List — vessel bypass documentation (26+)
▸ Economic analysis — $500M daily blockade cost estimate